SmartHR’s History
-
2013
- KUFU, Inc. established

-
2015
- Seed funding: 30 million yen
- After 11 business pivots, released “SmartHR”
- Awarded first prize at TechCrunch Tokyo 2015


-
2016
- Pre-series A funding: 40 million yen
- Series A funding: 500 million yen
- Awarded first prize at HR Awards 2016 (HR & Labor Section)
-
2017
- Company rebranded to SmartHR, Inc.
- Revamped corporate & service logo

-
2018
- Series B funding: 1.5 billion yen
- Reached 10,000 registered companies on SmartHR
- Selected for the J-Startup program
- Revised corporate mission to “Hacking Society’s Irrationalities”

-
2019
- Opened Kansai branch
- Series C funding: 6.15 billion yen
- Launched Talent Management product

-
2020
- Opened Kyushu branch
- Reached 30,000 registered companies on SmartHR
- Opened Tokai branch
-
2021
- Series D funding: 15.6 billion yen, achieved unicorn status
- Established group company: Smart Sodanshitsu
- Awarded first prize at Transit Advertising Awards 2021

-
2022
- Masato Serizawa appointed CEO
- Company reached 500 employees
-
Established group company Nstock
- * Now independent from the SmartHR Group
- Revised corporate mission to “Well-Working, Well-Being: Solving societal issues surrounding work and creating a society where everyone can choose how they contribute.”
- Reached 50,000 registered companies on SmartHR


-
2023
- Achieved T2D3, ARR reached 10 billion yen
- Opened Chugoku branch

-
2024
- Reached 1,000 employees
- ARR reached 15 billion yen
- Certified as a Great Place To Work
- Series E funding: 21.4 billion yen
- Received the Prime Minister's Award at the Nippon Startup Awards 2024
- Released service-based rebranding: SmartHR Labor Management and SmartHR Talent Management
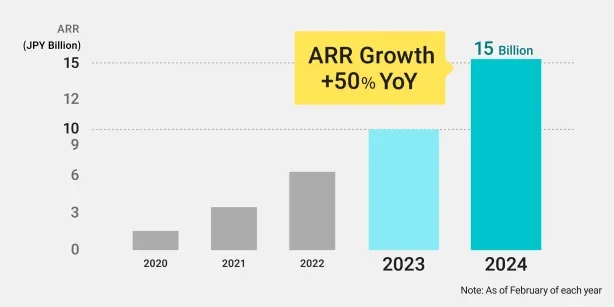
- ※1 Annual Recurring Revenue as of the end of each quarter. Calculated by multiplying the Monthly Recurring Revenue (MRR) of SmartHR, Inc. for the target month by 12. MRR is the total amount of monthly fees from paying customers as of the end of the final month in the target period (excluding one-time revenues).
- ※2 As of the end of February 2024. The chart compares the figures as of the end of February for each year.